
www.qclabequipment.com
CUSTOMER SERVICE * SALES * TECHNICAL SUPPORT
DELIVERIES WORLDWIDE
PERFORMANCE GUARANTEE

Telephone (804) 318-3686 Toll Free US (866) 244 1578 Fax (703) 991-7133 Hours 8 AM - 6 PM EST INTERNATIONAL & DOMESTIC SALES
-
 AGGREGATE SIZING
- SIEVER VACUUM
- BALANCES
- BRIX METERS
- SINAR TECHNOLOGY
- COLOR SHADE ANALYSIS
- COLOR SHADE ANALYZER
- COLOR SHADE INLINE
- CONSISTENCY METHOD
- SAMPLE CONTAINERS
- PARTICLE SIZE INLINE
- HOMOGENIZERS
- GERMINATION TESTING
- GRAVEL SAND PARTICLE SIZE
- MOISTURE AGRICULTURE
- MOISTURE INLINE CONTACT
- OVEN ALTERNATIVES
- MOISTURE KARL FISCHER
- MOISTURE DETERMINATION
- OVENS
- PROTEIN AGGREGATES
- RICE LAB
- SAMPLE BLENDERS
- SAMPLERS
- SEED COUNTER
- SIEVING SOFTWARE
- TABLET MAKING MACHINE
- VISCOSITY

MANUFACTURING DISTRIBUTION TECHNICAL SERVICES FOR ANALYTICAL INSTRUMENTATION
TELEPHONE (804) 318-3686 TOLL FREE (866) 244-1578
EQUIPMENT FOR QUALITY CONTROL AND R&D COLOR DETERMINATION BY SHADE DETECTION
STORE SEARCH
COMPLETE INTERACTIVE SAMPLER CATALOGUE PDF DOWNLOAD
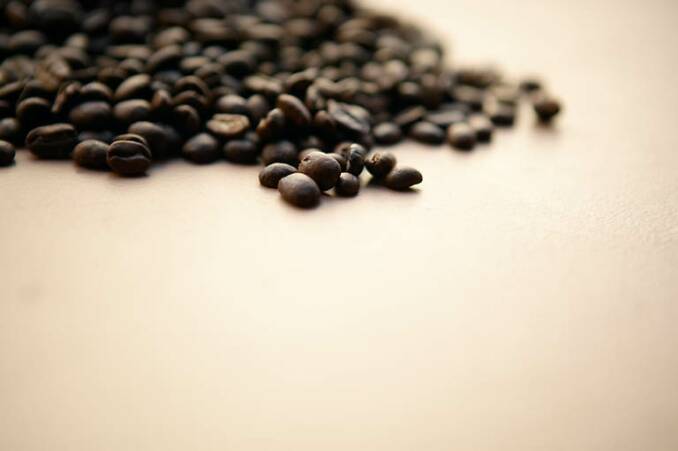
Coffee roasting is a complex process in regards to color analysis, because roasting at different temperatures, results in different end products, that can, and do have the same color attributes.
Time, temperature, and color all have to be monitored simultaneously.
Contact Us
We will get back to you as soon as possible
Please try again later
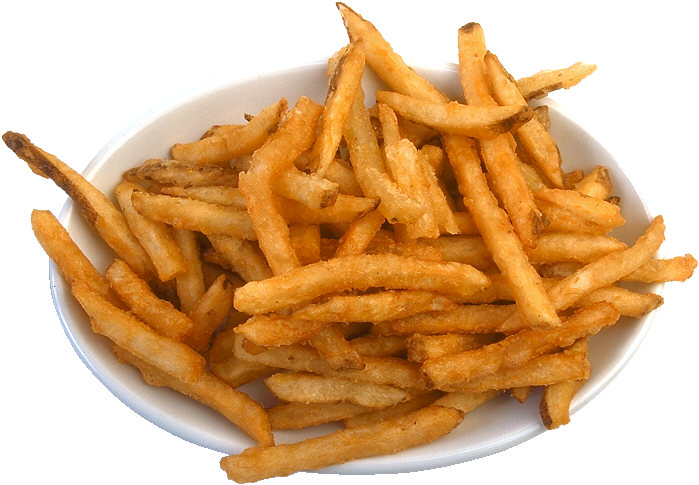
ColorTrack Laser Module French Fries are another example where color analysis is actually shade analysis. Older technologies require extensive sample preparation, and the sample must be manually turned in front of the limited number of sensor spots, to help represent more of the sample.
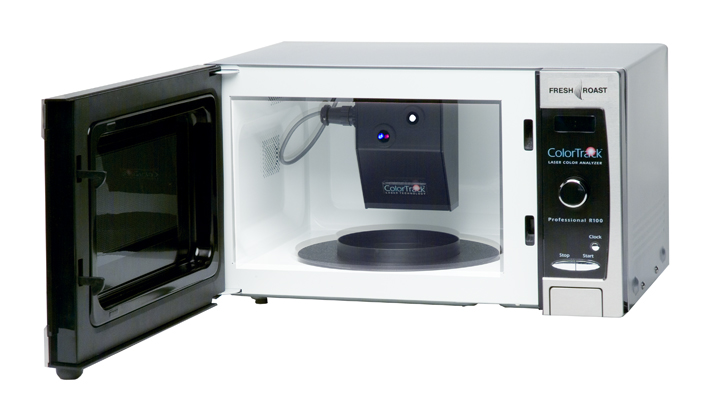
The ColorTrack Benchtop, takes advantage of a microwave oven platform, as pictured below, to scan the moving sample. The entire path of the laser is scanned, at a rate of 10,000 signals per second. The average recommended scan takes 20 seconds, and the results are provided in statistical format, including the average values, minimum and maximum values, mode, and standard deviation.
It's easy to see why, in color measurement, as well as in other disciplines, more data gives more representative results. Also, because it is the shade of color that represents how far along the process is, for many applications, trying to adapt to a human eye simulation model, presents it's own set of technological challenges, that are of no direct benefit. GIMME DATA
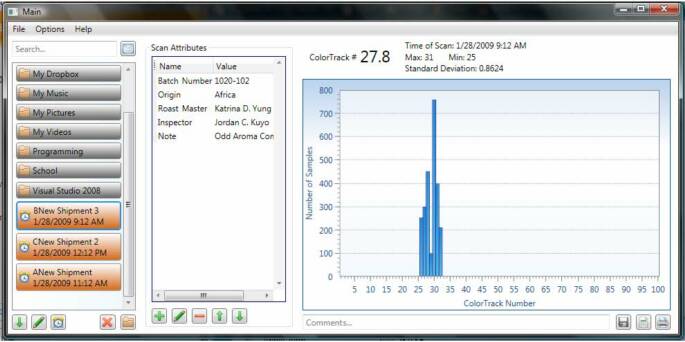
- AVERAGE VALUE -Average of all signals measured throughout the scan
- MODE VALUE -The reading that occured the most times during the scan.
- MINIMUM AND MAXIMUM VALUES -The highest and lowest values that occured during the scan
- STANDARD DEVIATION -This value represents the square root of the variance, and is widely used to measure the variability or dispersion.
Using sophisticated software, the results of a 20 second scan (200,000 individual transmissions) are tabulated, and presented along with a grahical representation.
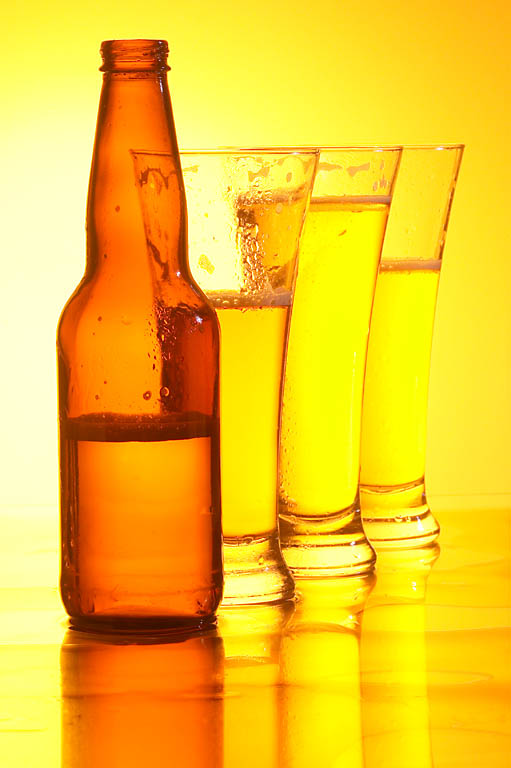
Barley hops for beer are easily measured with ColorTrack
WHITESTONE VA TEL (804) 318-3686 FAX (703) 991-7133 INFORMATION@QCLABEQUIPMENT.COM WWW.QCLABEQUIPMENT.COM Copyright 2012: QAQC Lab | Particle Measurement System | All rights reserved. 804-318-3686 | sales@qclabequipment.com